 Sukhdev Kamboj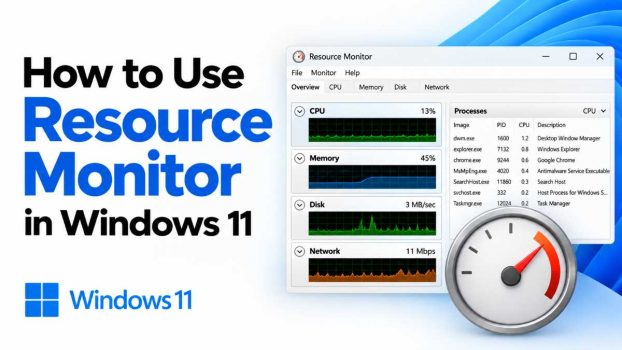
Every Windows 11 user eventually runs into the same frustrating scenario: the laptop fan spins up, the system slows to a crawl, and the culprit is nowhere to be found. Most people reach for Task Manager first, and while it’s a solid tool for a quick glance at CPU or memory usage, it doesn’t always tell the full story. That’s where Resource Monitor comes in.
Resource Monitor is one of the most underrated built-in utilities in Windows 11. It offers a far more granular, real-time view of exactly how your system’s CPU, memory, disk, and network resources are being consumed — process by process, file by file, and connection by connection. Unlike Task Manager, which gives you a broad summary, Resource Monitor lets you drill down into specifics: which process is writing to your disk right now, which application has a particular file locked, or which service is making a network connection to a suspicious IP address.
Whether you’re a casual user trying to figure out why your PC feels sluggish, an IT professional diagnosing a performance bottleneck, or a power user who simply likes to know what’s happening under the hood, Resource Monitor is a tool worth mastering. Best of all, it’s already installed on every Windows 11 machine — no downloads, no third-party software, and no cost involved.
In this guide, we’ll walk through exactly how to open and use Resource Monitor in Windows 11, explore each of its five main tabs, and answer some of the most common questions users have about this tool. By the end, you’ll have a solid understanding of how to use Resource Monitor to troubleshoot performance issues and keep a closer eye on your system’s health.
Method: How to Open and Use Resource Monitor in Windows 11
There are several ways to launch Resource Monitor in Windows 11, and once you’re in, the interface is organized into five tabs that each focus on a different type of system resource. Here’s a complete walkthrough.
Step 1: Opening Resource Monitor
You have multiple options for launching the tool, so pick whichever is fastest for you:
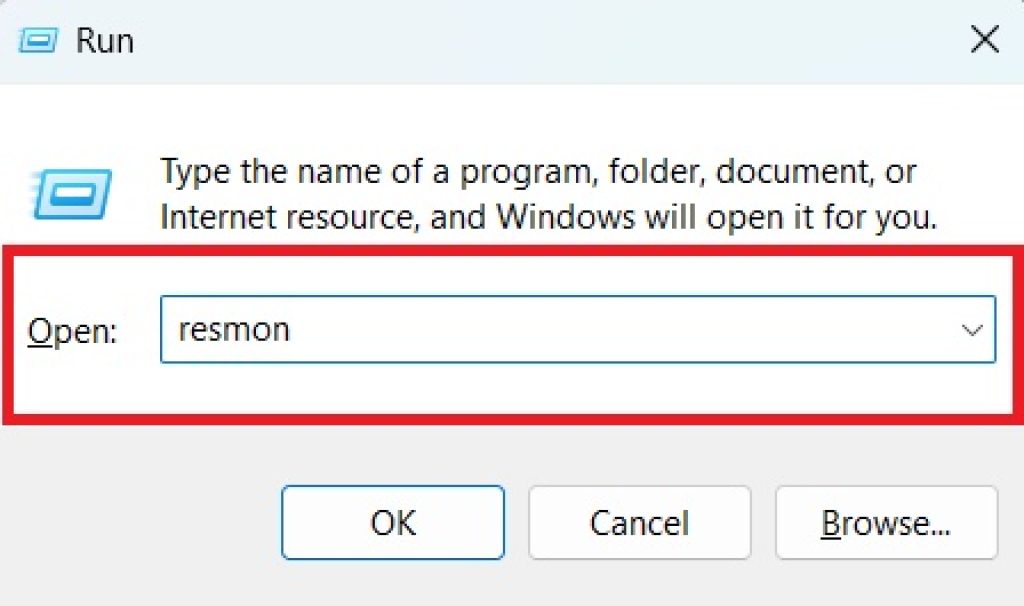
Via the Run dialog: Press Windows key + R, type resmon, and hit Enter. This is the quickest method for most users.
Via Task Manager: Open Task Manager (Ctrl + Shift + Esc), click on the Performance tab, and at the bottom you’ll see a link labeled Open Resource Monitor. Click it.
Via the Start menu search: Click the Start button or press the Windows key, type “Resource Monitor,” and click the app when it appears in the results.
Via Control Panel: Open Control Panel, go to System and Security > Administrative Tools, and double-click Resource Monitor.
Once opened, Resource Monitor will display a window with an Overview tab active by default, along with four additional tabs: CPU, Memory, Disk, and Network.
Step 2: Understanding the Overview Tab
The Overview tab is your dashboard. It shows four collapsible panels — CPU, Disk, Network, and Memory — each summarizing the most active processes for that resource. On the right side, you’ll see four live graphs tracking overall usage over time.
This tab is a great starting point when you’re not sure what’s causing a slowdown. Simply scan across the four panels to see which resource has unusually high activity, then head to that specific tab for more detail.
Step 3: Digging into the CPU Tab
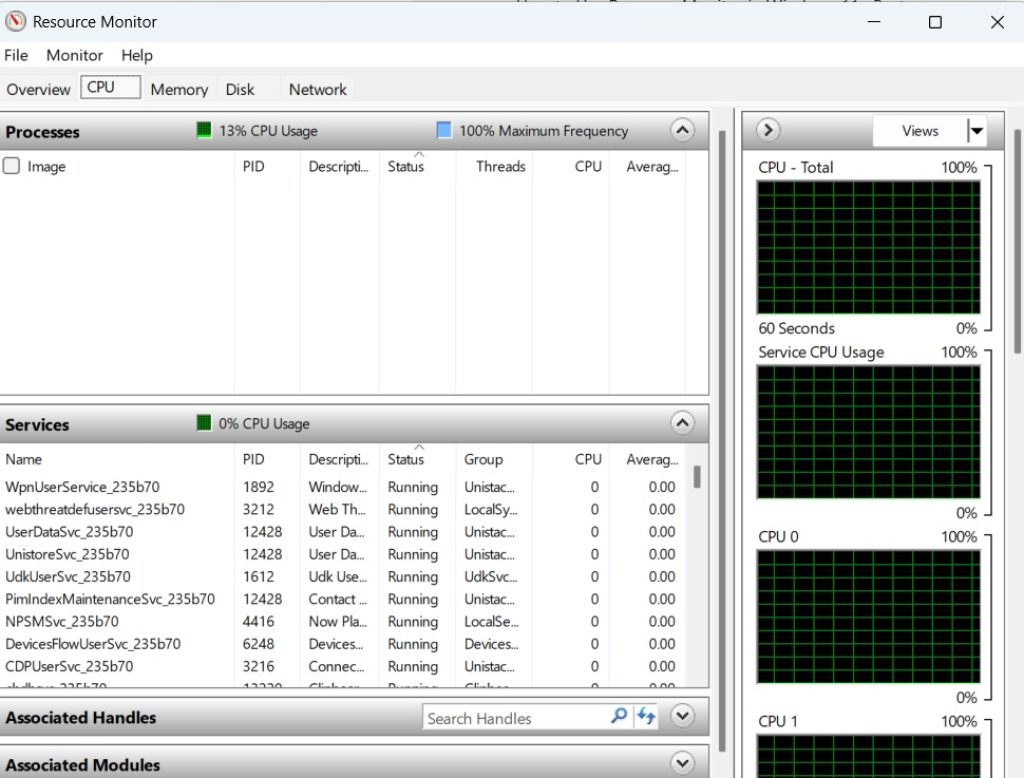
The CPU tab breaks down processor usage by individual process, showing the process name, PID (Process ID), description, status, threads, CPU percentage, and average CPU load. Below that, you’ll find:
- Services — shows which background services are consuming CPU cycles.
- Associated Handles — lets you search for a specific handle (a system resource reference) and see which process owns it. This is useful for figuring out why a file won’t delete because it’s “in use.”
- Associated Modules — displays the DLL files and modules loaded by a selected process, helpful for diagnosing software conflicts.
To investigate a process, click its checkbox in the top list. The Associated Handles and Modules sections will automatically filter to show only information relevant to that process.
Step 4: Monitoring Memory Usage
The Memory tab lists every running process along with detailed memory statistics: Commit size, Working Set, Shareable, and Private memory. These numbers help distinguish between processes hogging RAM versus those simply reserving it.
At the bottom of this tab, a colorful bar graph visualizes your system’s total physical memory, broken into categories like Hardware Reserved, In Use, Modified, Standby, and Free. This is particularly useful for identifying memory leaks — if the “In Use” portion keeps climbing steadily without leveling off, a specific application may not be releasing memory properly.
Step 5: Analyzing Disk Activity
The Disk tab shows real-time read and write activity for every process accessing your storage drives. Each entry displays the file path being read or written, along with read/write speeds in bytes per second.
This is especially handy for identifying which application is hammering your hard drive or SSD, causing your system to feel unresponsive. If you notice a background process constantly writing to disk when you’re not actively using it, that’s a strong lead for troubleshooting.
The Storage panel at the bottom lists each physical disk along with its current activity percentage and response time — a high response time (measured in milliseconds) often indicates the disk is struggling to keep up with demand.
Step 6: Reviewing Network Activity
The Network tab displays every process making network connections, along with the remote address, port, and data transfer rates. This is one of the most useful tabs for spotting unexpected network activity — whether it’s a legitimate app checking for updates or something more suspicious you weren’t expecting.
Below the process list, you’ll find:
- Network Activity — per-process send/receive rates.
- TCP Connections — a full list of active connections with remote IP addresses and ports, useful for basic security checks.
- Listening Ports — shows which processes have ports open and listening for incoming connections, which can help identify unnecessary exposure.
Step 7: Filtering by Process
One of Resource Monitor’s most powerful features is cross-tab filtering. If you check a process’s box in any tab, that filter carries over to the other tabs too. For example, checking “chrome.exe” in the CPU tab and then switching to the Memory or Network tab will show you only Chrome-related data. This makes it easy to build a complete resource profile for a single application.
Step 8: Ending or Suspending Problem Processes
If you identify a process that’s misbehaving, right-click it in any tab to access options like End Process, End Process Tree, or Suspend Process. Suspending is particularly useful for temporarily pausing a resource-hungry background task without fully closing the application, giving your system breathing room while you finish something urgent.
Conclusion
Resource Monitor may not have the polished, modern look of some of Windows 11’s newer utilities, but it remains one of the most powerful diagnostic tools built into the operating system. Where Task Manager gives you a quick snapshot, Resource Monitor gives you the full investigative toolkit — letting you trace CPU spikes to specific threads, track down which process is locking a file, spot memory leaks before they crash your system, and monitor network connections for anything out of place.
Learning to navigate its five tabs — Overview, CPU, Memory, Disk, and Network — turns troubleshooting from guesswork into a methodical process. The next time your PC slows down unexpectedly, skip the reboot-and-hope approach and open Resource Monitor instead. With a bit of practice, you’ll be able to pinpoint the exact cause of a performance issue in minutes rather than hours.
Frequently Asked Questions
1. What’s the difference between Resource Monitor and Task Manager?
Task Manager provides a quick, high-level overview of system performance and is best for basic tasks like closing unresponsive apps or checking overall CPU and memory usage. Resource Monitor goes much deeper, offering process-level detail across CPU, memory, disk, and network activity, including specific file paths, network addresses, and handle information. Think of Task Manager as the dashboard and Resource Monitor as the diagnostic scanner.
2. Why does Resource Monitor show high disk usage even when I’m not doing much?
This is often caused by background processes such as Windows Update, antivirus scans, search indexing, or cloud sync services like OneDrive. Check the Disk tab to see which specific process is generating the activity. If it’s a service you don’t need running constantly, you can usually adjust its settings or scheduling from within its own application, rather than disabling it through Resource Monitor itself.
3. Can I use Resource Monitor to fix a “file in use” error?
Yes, this is one of its best use cases. Go to the CPU tab, scroll to the Associated Handles section, and type the file name (or part of it) into the search box at the top. Resource Monitor will show you exactly which process currently has that file open, allowing you to close the correct application instead of guessing.
4. Is it safe to end processes from Resource Monitor?
Generally yes, but caution is still important. Ending a non-essential background application is usually safe, but forcibly closing critical Windows system processes can cause instability or data loss in open applications. If you’re unsure what a process does, it’s worth doing a quick search on its name before ending it, and always save your work in other open programs first.