 Sukhdev Kamboj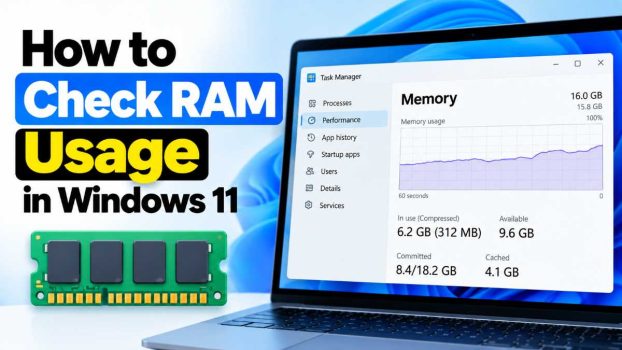
Random Access Memory (RAM) is one of the most important components in your computer, directly affecting how smoothly your system runs multiple applications, browser tabs, and background processes. When your PC starts to feel sluggish, freezes unexpectedly, or apps take longer to load, insufficient or overburdened RAM is often the culprit. Knowing how to check RAM usage in Windows 11 helps you diagnose these issues, decide whether you need a RAM upgrade, and identify which programs are hogging your memory resources.
Windows 11 offers several built-in tools to monitor RAM usage, ranging from simple, at-a-glance views to detailed, technical breakdowns. Whether you’re a casual user wanting a quick check or a power user needing granular data, there’s a method suited to your needs. This guide walks you through the most effective ways to check RAM usage in Windows 11, along with tips on interpreting what you see and answers to frequently asked questions.
Why Checking RAM Usage Matters

Before diving into the methods, it’s worth understanding why this matters. RAM acts as your computer’s short-term memory, temporarily storing data that active programs need to access quickly. Unlike your hard drive or SSD, which retains data permanently, RAM only holds information while your computer is powered on and the relevant program is running.
When your RAM usage consistently sits near 100%, your system compensates by using “virtual memory,” a portion of your storage drive that acts as overflow RAM. This process, while functional, is significantly slower than actual RAM, leading to lag, stuttering, and delayed response times. Monitoring RAM usage regularly allows you to catch these bottlenecks early, close unnecessary applications, or make an informed decision about upgrading your hardware.
Method 1: Using Task Manager
Task Manager is the most straightforward and commonly used tool for checking RAM usage in Windows 11. It provides both a high-level overview and detailed per-application breakdowns.
Steps:
Right-click the Start button or press Ctrl + Shift + Esc to open Task Manager directly.
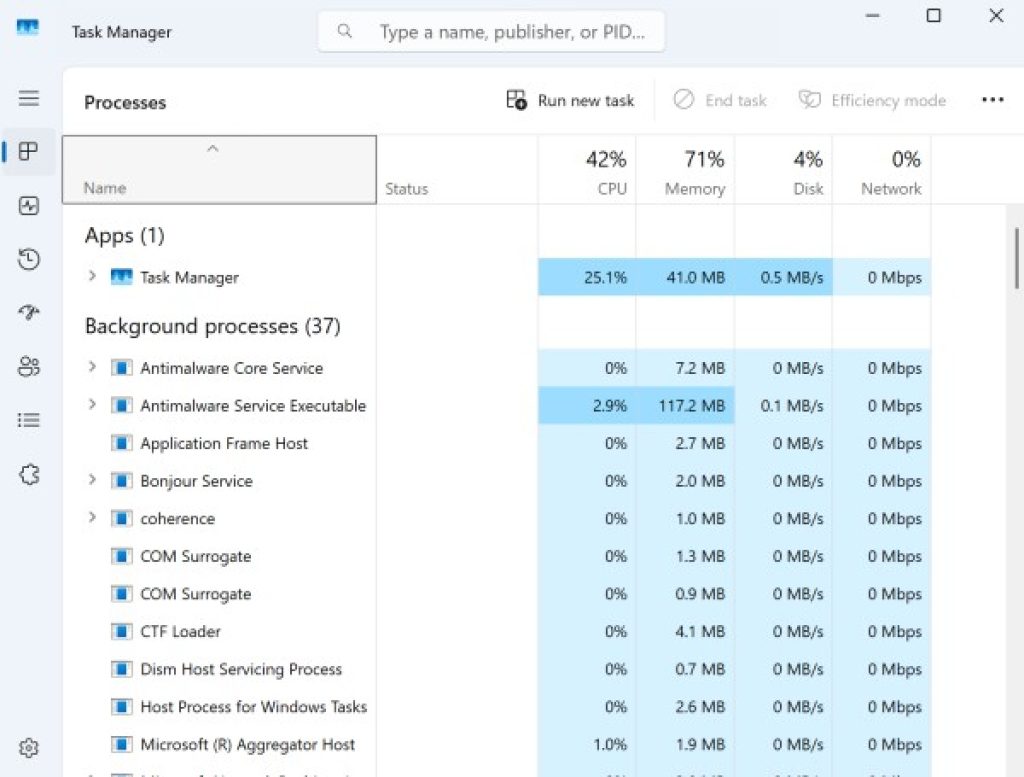
If Task Manager opens in compact mode, click More details at the bottom left.
Click the Performance tab.
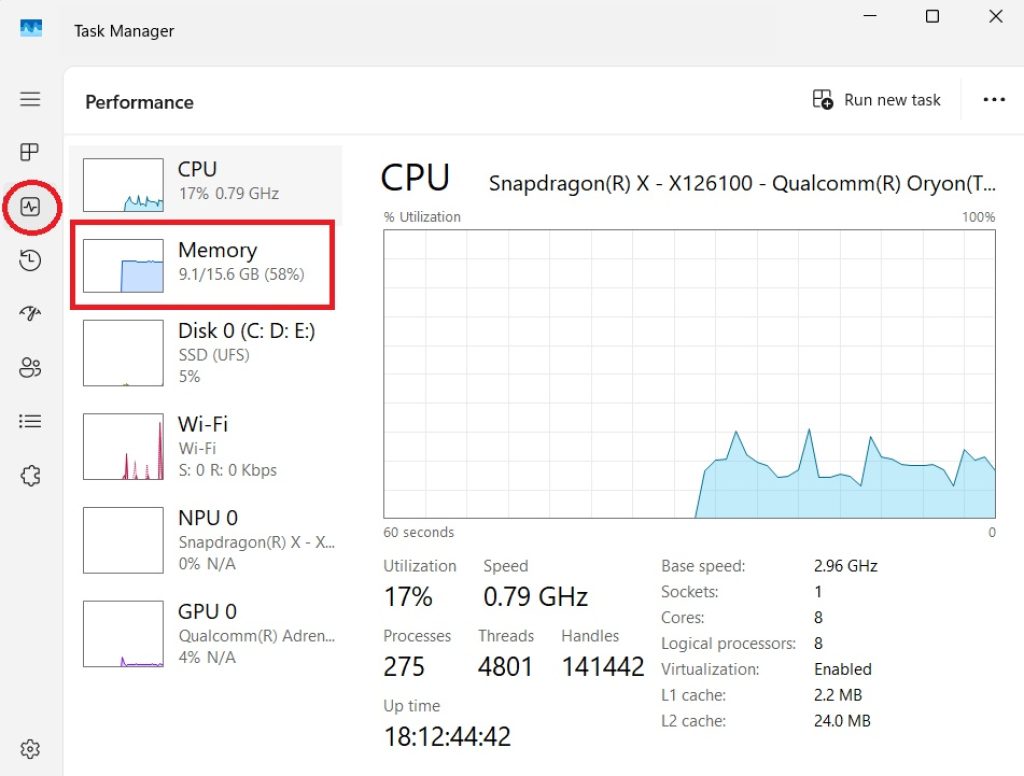
Select Memory from the left-hand sidebar.
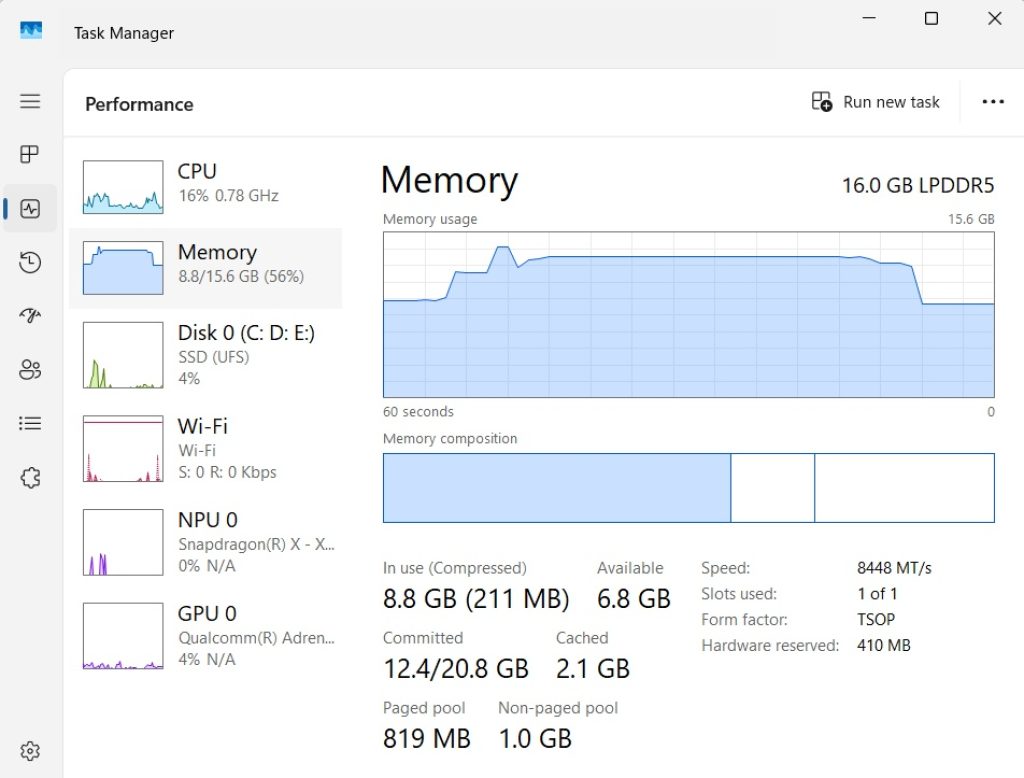
Here, you’ll see a real-time graph showing memory usage over the past 60 seconds, along with key statistics including:
- In use (Compressed): The amount of RAM currently being used by active processes.
- Available: RAM that’s free and ready for use.
- Committed: Total memory allocated to programs, including any virtual memory being used.
- Cached: Memory used to store recently accessed data for quicker retrieval.
- Paged pool and Non-paged pool: Memory reserved for the operating system’s use.
- Speed, Slots used, Form factor: Technical details about your installed RAM modules.
To see which specific applications are consuming the most memory, click the Processes tab and then click the Memory column header to sort applications from highest to lowest usage. This is particularly useful for identifying memory-hungry browser tabs, background apps, or misbehaving software.
Method 2: Using the Settings App
If you prefer a simpler visual summary without diving into Task Manager, Windows 11’s Settings app offers a built-in memory usage overview.
Steps:
- Open Settings by pressing Windows key + I.
- Navigate to System > About.
- Alternatively, go to System > Storage and click on a drive to see storage-related memory usage (note this is different from RAM).
For a more direct RAM check within Settings, you can also go to:
- Settings > System > Display > Advanced display, though this won’t show RAM directly.
- The most relevant path is Settings > System > About, where under Device specifications, you’ll find your Installed RAM listed, showing total capacity and usable amount.
While Settings doesn’t provide real-time usage graphs like Task Manager, it’s a quick way to confirm how much total RAM your system has and whether all of it is accessible to the operating system (sometimes a portion is reserved for hardware).
Method 3: Using Resource Monitor
For users who want more granular data than Task Manager provides, Resource Monitor is a powerful built-in utility that breaks down memory usage by process, including hard faults, commit size, and working set details.
Steps:
- Open Task Manager using Ctrl + Shift + Esc.
- Click on the Performance tab.
- At the bottom, click Open Resource Monitor.
- Alternatively, type “Resource Monitor” into the Windows search bar and open it directly.
- Click the Memory tab within Resource Monitor.
Resource Monitor displays:
- A list of all running processes with their exact memory consumption in kilobytes.
- Hard Faults/sec: Indicates how often data had to be retrieved from the disk because it wasn’t available in RAM, a sign of memory pressure.
- Commit: Total memory space reserved for a process.
- Working Set: The amount of physical memory currently in use by the process.
- Shareable and Private memory breakdowns.
A colorful graph at the bottom visually represents used physical memory, standby memory, free memory, and hardware reserved memory. This tool is ideal for advanced troubleshooting, especially when trying to pinpoint a specific application causing memory leaks or excessive consumption over time.
Method 4: Using Command Prompt or PowerShell
For users comfortable with command-line tools, Windows 11 allows you to check RAM usage using simple commands, which is especially useful for scripting, remote diagnostics, or quick checks without opening a graphical interface.
Using Command Prompt:
- Press Windows key + R, type
cmd, and press Enter. - Type the following command and press Enter:
systeminfo | findstr /C:"Total Physical Memory" /C:"Available Physical Memory"This displays your total installed RAM and how much is currently available.
Using PowerShell:
- Open PowerShell by searching for it in the Start menu.
- Run the following command for a detailed memory summary:
Get-CimInstance Win32_OperatingSystem | Select-Object TotalVisibleMemorySize, FreePhysicalMemoryThis returns memory values in kilobytes, which you can convert to gigabytes by dividing by 1,048,576.
For a breakdown of memory usage by process, you can run:
Get-Process | Sort-Object WS -Descending | Select-Object -First 10 Name, WSThis lists the top 10 processes consuming the most working set memory, giving you a scriptable alternative to Task Manager’s process list.
Interpreting Your RAM Usage Results
Once you’ve checked your RAM usage, understanding what the numbers mean is just as important as gathering them. Generally, if your usage consistently hovers between 60-80% during normal use, your system is functioning within a healthy range. If usage frequently spikes to 90% or above, especially when running only a few applications, this may indicate:
- Too many background processes or startup programs consuming resources unnecessarily.
- A memory leak in a specific application that isn’t releasing RAM properly after use.
- Insufficient RAM for your workload, particularly if you multitask heavily, edit video, or run virtual machines.
If you notice one particular application consistently using a disproportionate amount of memory relative to its function, consider updating it, restarting it periodically, or checking online forums for known memory leak issues with that software.
Conclusion
Monitoring RAM usage in Windows 11 doesn’t require third-party software, thanks to the variety of built-in tools available. Task Manager offers the quickest and most accessible overview for everyday users, while Resource Monitor and Command Prompt/PowerShell provide deeper technical insights for troubleshooting persistent performance issues. The Settings app, meanwhile, is useful for a fast confirmation of your total installed memory.
Regularly checking your RAM usage can help you catch performance bottlenecks before they become frustrating slowdowns, identify problematic applications, and make informed decisions about whether a RAM upgrade is worthwhile for your usage patterns. Whether you’re a casual user troubleshooting a sluggish laptop or an IT professional diagnosing enterprise systems, Windows 11 equips you with the tools needed to keep tabs on this critical system resource.
Frequently Asked Questions
1. What is considered normal RAM usage in Windows 11?
Normal RAM usage varies depending on your total installed memory and what you’re running, but generally, usage between 40-70% during typical multitasking (browsing, office work, streaming) is considered healthy. Windows itself uses a portion of RAM for background system processes even at idle, so seeing 20-30% usage with no applications open isn’t unusual. Consistent usage above 90%, especially with only a few lightweight programs running, often signals a problem worth investigating, such as a misbehaving background process or insufficient RAM for your needs.
2. Why does my RAM usage stay high even after closing programs?
This is often due to Windows’ memory management design, specifically a feature called Standby Memory or Superfetch/SysMain. Windows intentionally keeps frequently used data cached in RAM even after you close an application, anticipating you might reopen it soon, since retrieving data from RAM is much faster than from a storage drive. This cached memory is technically “in use” but is immediately released if another application needs it. If you’re concerned, check the Available and Free figures in Resource Monitor rather than just the overall “in use” percentage, as available memory typically includes this reclaimable standby cache.
3. How much RAM do I actually need for Windows 11?
Microsoft’s official minimum requirement for Windows 11 is 4GB, but this is only sufficient for very basic tasks and will likely feel restrictive for everyday use. For comfortable general use, including web browsing with multiple tabs, office applications, and light multitasking, 8GB is typically recommended as a practical baseline. Users who game, edit photos or video, run virtual machines, or work with large datasets should consider 16GB or more, as these workloads are considerably more memory-intensive and 8GB can quickly become a bottleneck.
4. Can I check RAM usage without opening any Windows tool?
While Windows’ built-in tools are the most direct method, several reputable third-party applications like HWiNFO, Speccy, and Process Explorer (from Microsoft’s own Sysinternals suite) offer alternative, often more detailed, ways to monitor RAM usage, including temperature sensors for memory modules and historical usage logging. Some of these tools can also run in the system tray, giving you a persistent, glanceable indicator of memory usage without needing to open Task Manager repeatedly. However, for most users, the native Windows 11 tools covered in this guide provide more than enough detail without needing to install additional software.